
Schema della sezione
-
LECTURE N.1 MON MARCH 2 2022 Auletta 2 CU026 11am-1pm NO_RECORD
to set the stage: Inaugural lecture (DA_2022_inaugural_lecture.pdf)data, metdata, ontologies
facts/things (Wittgenstein redux: 1.1 the world is the totality of facts not of things)
data tables (objects/descriptors)
Galilei's remouval of the animal at the origin of moderm science, based on physics
styles of physics and styles of biology: "geometry vs. stamp collection" (?)
randomness, noise
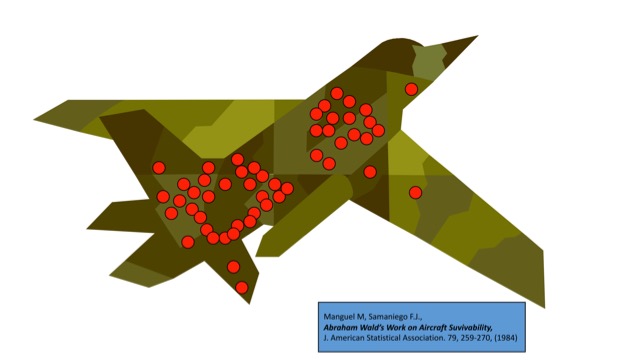
evolution and randomness: the case of surviving war planes
elements of the scientific method
the universal structure of a scientific paper
-
-
LECTURE N.2 MON MARCH 7 2022 Auletta 2 CU026 11am-1pm
structure of a scientific paper (2), peer review, open access
repositories: Bioarxiv, Pubmed
complexity/simplicity: from Galilei’s “simplicity” to Parisi’s “complexity”
evolutionary time, randomness (again)
the computational dimension (advent of computers. Moore’s law)
computational medicine/computational phychiatry
cell biology by the numbers (Milo & Phillips)
Points of significance (Naomi Altman): Association, correlation and causation
-
-
LECTURE N.3 WED MARCH 9 2022 Auletta 2 CU026 11am-1pm REC
observations/ models / facts
stochastic/deterministic models
parameters
correlation is not causation
population/sample
random samples
Istograms probability distributions
-
-
LECTURE N.4 MON MARCH 14 2022 Auletta 2 CU026 11am-1pm REC
samples, statistic, estimation (biased/unbiases)
indexes of localisation/dispersion
random samples
pseudoreplication (Lazic2010)
means: Chisini’s criterion (Graziani2009)
median, mode
symmetric, asymmetric distributions -
-
LECTURE N.5 WED MARCH 16 Auletta 2 CU026 11am-1pm REC
modes of science: deduction, deduction, abduction
measures of spread of sampled variables
range
quantiles
interquartile range
sample variance and standard deviation
coefficient of variation
variance and standard deviation
modes of organising data: scatter plots, bar graphs, pie charts, strip charts, box plots
frequency tables/histograms/binning/resolution
sampling the distribution of estimates (statistics)
the mean of means
self-averaging/non self-averaging quantities
-
-
LECTURE N.6 MON MARCH 21 Auletta 2 CU026 11am-1pm REC
anatomy of a box-plot
strip charts
shapes of histograms (optimize: binning/resolution)
the sampling distribution of a mean (mean of means)
the distribution of human genes (see W&S chap4)
events, experiment, probability
definitions of probabilities: classic, frequentist, subjective
axioms of probabilities
events, sets, propositions (logic)
conditional probabilities -
LECTURE N.7 Wed MARCH 23 Auletta 2 CU026 11am-1pm REC
conditional probabilities, correlated (overlapping, interphering) events
algebra of events (dependent/independent)
total probability rule
Bayes’ formula -
-
LECTURE N.8 MON MARCH 28 11am-1pm ON LINE REC
Bayes’ formula, partitions of events as cognitive bases
Bayes’ Theorem
example: appliaction to a classification problem on protein sequences
sensitivity and selectivity of a classification -
-
LECTURE N.9 WED MARCH 30 11am-1pm ON LINE REC
discussion of Bulashevska2008
intrinsically disordered proteins
Discussion of Puga2015a (Altman series) presented by Martina Roiati
Confusion Matrices
ROC curves(Fawcett2006)Jackknife -
-
LECTURE N.10 MON APRIL 4 ONLINE 11am-1pm REC
Null and alternative hypotheses
Test statistic and the null distribution
p-value
level of statistical significance: errors of type I and II
Bilateral/unilateral tests(see Whitlock&Schluter chap. 6, see also Rosner 7.1,7.2) -
-
LECTURE N.11 WED APRIL 6 11am-1pm ONLINE RECProportions (and the binomial distribution)The Binomial distributionSampling the proportions: parameter estimates, uncertaintyTesting proportions: the binomial test
Study materials: Whitlock and Schluter chap.7
further reading: W&S interleaf 3: why statistical significance is not the same as biological importance?
W&S Interleaf 4 Correlation does not require causation (see “Spuriuous Correlations” a nice website:
http://www.tylervigen.com/spurious-correlations
Problem 13 from W&S -
-
Standard error of the mean
LECTURE N.12 MON APRIL 11 Auletta 2 CU026 11am-1pm REC
Estimators vs parameters
Point estimates vs interval estimatrion
Random numbers and random samples
Central limit theoremInterval estimationt-distribution (Student)Chi-square distribution
Percentiles and confidence intervalsThe study material for this lecture can be found in chap. 6 of Rosner’s textbookand chap.10 and 11 of W&S -
-
DA_2022 LECTURE 13 WED APR 13 11-13 auletta 2 CU026
-The bootstrap Montecarlo method to evaluate estimates and confidence interval
from just one sample (see R chap 6.7, and W&S chap 19)
-confidence intervals definition and evaluation using t-distributions and chi-square distributions formulas and examples.
HOMEWORK to be done on the LOG-BOOK
REVIEW QUESTION 6B AND & 6C in Rosners’ textbook
The study material for this lecture can be found in chap. 6 of Rosner’s textbook
-
-
LECTURE N.14 WED APRIL 20 On line REC
One sample/two sample tests
One sided test/two sided test
Parametric/non parametric tests
Type I and Type II errors, Power of a test
Test flowchart (R p.268)
One sample test for the mean of a normal variable (one sided/two sided test R 7.3/R.7.4))
Acceptance/rejection regions
P-values
Rosner’s chapter 7 and Whitlock’s chap. 6
As an home work for next mondy please complete by yourself the study of the first paragraphs (7.1,7.2, 7.3 and 7.4 by Rosner)
In particular consider the review questions 7A p.222 of R IN THE LOGBOOK -
-
LECTURE N.15 WED APRIL 27 11am-1pm auletta 2 CU026 REC
Parametric vs. non parametric testsFormal structure of a test: parameter space and the space of samples
Role of H0
Critical regions
Mapping beween parameter and sample space: type I and Type II errors
Amplitude and power of a test
Optimal critical regionStudy materials:
Rosner’s chap. 7 par. 7.1- and lecture notes DA_2020_L18_notes
-
-
LECTURES N 16 (02 May2022) and N17 (04 May 2022) AULETTA 2 11am-1pm
One sample vs two sample tests MOTIVATION
General reference for this topic: Rosner’s chapter 8 and Whitlock’s chap. 12
Assumption of normality (see Whitlock chap.13)
Two samples (cross-sectional, synchronic studies) vs longitudinal paired tests (longitudinal, diachronic studies)
The paired t-test (R 8.2) [paired t-test statistic, acceptance region, p-value, interval estimation (R.8.3)]
Two sample test for independent samples with equal variances: acceptance region, p-value (R. 8.4), interval estimation (R.8.5)
Testing for the equality of variances (R section 8.6): the F distribution, The F-test
Two sample t test for independent samples with different variances (R. 8.7) (self study)
-
-
DA_2022 LECTURE N.18 Monday may 9 auletta 2 11am-1pm
•The problem of non-normal distributed data•Transformations: lognormal distributions•Tests of normality•Non parametric tests•Sign test•Binomial distributionStudy materials:
Rosner’s chapter 9 and Whitlock’s chap. 13 (very good)
MOREOVER: As an exercise (to be recorded in the logbook) I suggest that you look at the very good scholarly lecture by professor Francesco Pauli of Trieste (in Italian) on the Neyman-Parson paradigm of testing hypotheses published on you tube
-
-
DA_2022 L 19 11 may 2022 auletta 2 11am 1pm
•Basic distinctions and concepts in inference: one sample/two samples/Multiple samples; power/significance (type I/type II errors) sample size/ experimental design•Overwiew of statistical test (see Rosner’s general flow-chart p.895;See also W&S interleaf on p. 465 which test I should use?
••The Wilcoxon rank sum test (Mann-Whitney U test) -
-
DA_2022 L 20 16 may 2022 auletta 2 CU026 11am 1pm
MULTIPLE PARAMETRIC/NON PARAMETRIC TESTS (R 12.1-12-4; 12.7)
Whitin group/between-group variability
One-way ANOVA
Bonferroni correction
Kruskal-Wallis tes
-
-
DA 2022 L21 18 may 2022 auletta 2 Cu026 11am 1pm
•F test statistics (see Rosners’ chapter 12 see R chap. 8.6)• Graded Homework Formally derive equation 12.4 and equation 12.5 in Rosner’s textbook•A glance to the jungle…(Rosner’s road map)•Further discussion of the ANOVA one way test•Kruskal-Wallis test -
-
DA_2022_L22 Monday May 23 auletta 2 11am-13 pm REC
•General notion of correlated events•General notion of correlation•Pearson’s Correlation Coefficient (sample)•Population Correlation coefficient•The mathematics of linearity: linear spaces of finite dimension, vectors,•Linear transformations, matrices•Discussion of geometric data analysis/dimensional reduction / classification/clustering)•Intro to Principal Component analysis (PCA)See Rosner 11.7, 11.8,11.14 W&S 16.1,16.2,16.3,16.4 -
-
DA_2022_L23 wed may 25 auletta 2 11 am-1 pm
Search for multivariate correlations in an object-descriptor data table
The language of linear mathematics: symbolic operators and numerical representatives
What is a vector? What is a linear transformations of a vector?
What is a change of reference frame (basis)?
The eigenvalue problem
Z-transform of an object-descriptor table
Find eigenvalues and eigenvectors of the covariance matrix such as to maximize variance
The (ordered) eigenvalues of the covariance matrix encode the variance contained in the original data. -
-
DA_2022_L24 monday may 30th auletta 2 11am-1pm
•Linear regression analysis independent/dependent variables)•Least squares method•W&S 17.1,17.2•Rosner 11.1, 11.3, 11,11.4 -