
Dear DA_2020 students,
I have updated the recordings and the outlines with slides in the e-learning platform.
Here is also attached the final syllabus of this year course.
FIRST OF ALL:
I INVITE YOU WARMLY TO FILL THE OPIS FORM OF OUR COURSE THE CODE IS BX0BU5SL
MODES:
The basic modality I propose for the exam is:
i) prepare a power point presentation of no more than 10 slides to illustrate one of the articles (your own choice) in the series Points of Significance by Naomi Altman and collaborators (https://www.nature.com/collections/qghhqm/pointsofsignificance )
ii) discuss a question (chosen by me) on the general program taken from the following list:
LIST OF STYLIZED QUESTIONS AND THEMES
The universal structure of a scientific paper
Bayes’Theorem
Why we do averages: Chisini's principles for the means
Standard error of the mean
First two momenta of a probability distribution and their estimators
Central limit theorem
Sensitivity vs specificity
ROC curves and Confusion Matrices
Type I and Type II errors in the test of hypotheses
p-values
parametric/non parametric tests
multiple tests: ANOVA
Kruskal-Wallis test
Principal component analysis
OF COURSE YOU CAN OPT FOR A MORE TRADITIONAL ORAL EXAM BASED ON THREE QUESTIONS.
DATA ANALYSIS (DA_2022) SYLLABUS
Academic Year 2021-2022, 6 ECTS.
A course for the Master Programs in Genetics and Molecular Biology and Neurobiology, given in the 2nd semester.
Instructor: prof. Andrea Giansanti, Sapienza University of Rome, Department of Physics, (Marconi Building (CU013), 2nd floor, room 211) tel. 0649914367 (3385075611)
andrea.giansanti@roma1.infn.it
Evaluation: based on the discussion of a research/methodological paper, written essays, written tests, home-works and participation to discussions : 40%. Final oral exam: 60%.
Recommended textbooks
[R] Bernard Rosner - Fundamentals of Biostatistics-Brooks Cole (2015).
[WS] Michael C. Whitlock and Dolph Schluter - The Analysis of Biological Data-W. H. Freeman and Company (2015)
Note: STUDY MATERIALS, LECTURE OUTLINES & NOTES, SLIDES CAN BE FOUND ON THE
e-learning Sapienza Platform: (course DA_2022) https://elearning.uniroma1.it/course/view.php?id=14921
Access to the recordings of the lectures, for strict personal use, can be requested from the instructor
0. INTRODUCTION (see also the inaugural lecture DA_2022_inaugural_lecture.pdf)
Data, Metadata, Ontologies.
Data/Models/Computation/Simulation
Facts/things (Wittgenstein redux: 1.1 the world is the totality of facts not of things)
Data tables (objects/descriptors)
Galilei's remouval of the animal at the origin of moderm science, based on physics
Styles of physics and styles of biology: "geometry vs. stamp collection" (?)
Randomness, noise
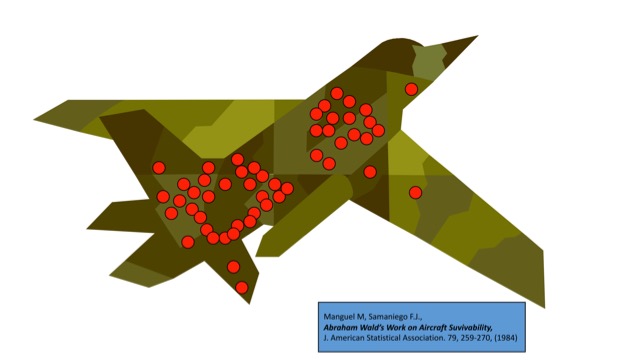
Evolution and randomness: the case of surviving war planes
Elements of the scientific method: observations/models
The universal structure of a scientific paper
Forms of reasoning: deduction, induction, abduction.
The issue of reproducibility
Science before and after the computer era
The birth of computational (in silico) biology
Computational systems biology/medicine
Numeracy (Cell biology by the numbers)
The Biological Bayesian revolution.
2. DATA AND THEIR REPRESENTATION (WS chap. 2, R 2.8)
types of data and variables (categorical, numerical)
displaying the data (scatter plots, bar graphs, pie charts, strip charts, box plots, frequency tables,
histograms: binning and resolution)
3. DESCRIPTIVE STATISTICS (R 2.1-2.6, W&S chap.3 (to be used as a rewiew reading))
measures of location (aritmetic mean, median, mode, mean vs median)
measures of spread (range, quantiles, variance and standard deviation, coefficient of variation)
Chisini's principles for the means [Graziani2009]
4. PROBABILISTIC REASONING (R 3.1-3.8, W&S chap. 5)
uncertainty and decisions
events, trials, uncertainty, probability
definitions of probabilities: classic, frequentist, subjective
graphical representations through Venn diagrams
dependent/independent events
addition and multiplication formulas
conditional probabilities
Bayes’ theorem and its relevance (subjective/objective, a fair representation of knowledge accumulation) [Puga2015]
Eikosograms (RW Oldford)[ https://cran.r-project.org/web/packages/eikosograms/vignettes/Introduction.html ]
5. BAYES’ THEOREM AND TESTS (see lecture n.10)
Clinical tests as binary classifications (R 3.7)
Clinical tests and conditional probabilities (R 3.8)
A bayesian classifier of protein sequences [Bulashevska2008]
ROC curves (R 3.9, see also [Fawcett2006])
Confusion matrices
Relative risk
6. PROBABILITY DISTRIBUTIONS
random variables (R 4.1- 4.6)
Probability distributions: discrete/continuous (R 5.1-5.4)
Moments of a probability distribution
The normal distribution (R 5.3-5.4, W&S chap. 10 suggested recapitulation reading)
Linear combinations of random variables (R 5.6)
Z-transform and percentiles of N(0,1) (R 5.5)
7. INFERENTIAL STATISTICS AND ESTIMATION (R 6.1-6.7 )
Population and samples moments and estimators
The arithmetic mean as maximum likelihood estimator of the first moment of a gaussian distribution [see notes DA_2020_L12_notes]
Random samples (tables of random numbers)
Biased/unbiased estimators
Point estimation of the mean
Standard error of the mean
Error bars [https://www.nature.com/articles/nmeth.2659 ]
Central limit theorem
Interval estimation
t-distribution, degrees of freedom
Confidence intervals for the mean of anormal distribution
Point estimator of the variance
Chi-square distribution, degrees of freedom
Interval estimation for the variance of a normal distribution
The bootstrap (R 6.11, [https://www.nature.com/articles/nmeth.3414])
8. HYPOTHESIS TESTING (one/two samples) ( R 7.1- 7.6; 8.1-8.4, 8.6 ,W&S chap. 6)
Formal aspects (see lecture notes included in L 18 slides)
Null hypothesis and alternative hypothesis.
Errors of Type I and Type II.
Confidence levels
Acceptance-rejection regions
p-value.
Power
One sample/two sample tests
One sided test/two sided test
Longitudinal/cross-sectional studies
Testing for the equality of two variances
F distribution
F test
9. NON PARAMETRIC TESTS (R 9.1-9.2; 9.4 ,W&S chap.13)
The problem of non-normal distributed data
Lognormal distribution
Tests of normality
Ranks
Sign test
Wilcoxon rank-sum test (Mann-Whitney U test)
10. MULTIPLE PARAMETRIC/NON PARAMETRIC TESTS (R 12.1-12-4; 12.7)
Whitin group/between-group variability
One-way ANOVA
Bonferroni correction
Kruskal-Wallis test
11. CORRELATION AND REGRESSION (R 11.1-11-5 ; 11.7, W&S chapp. 16 and 17 )
Association of variables, correlations/dependencies
Correlation is not causation [https://www.nature.com/articles/nmeth.3587]
The mathematics of linearity: vectors, matrices, linear transformations
Linear regression analysis independent/dependent variables
Least squares method [see handout SJ Miller]]
The correlation coefficient
Principal component analysis (PCA) [see Higgs&Attwood chap. 2]